The year 2026 serves as a significant chronological marker in the history of global macroeconomics, representing the formal conclusion of the post-WWII economic hierarchy and the emergence of a multi-polar financial order. Central to this transition is the ascendance of India, which has systematically surpassed Japan to claim the position of the world’s fourth-largest economy by nominal Gross Domestic Product (GDP). This shift is not a fleeting statistical anomaly but the culmination of structural reforms, demographic transitions, and a fundamental realignment of global supply chains. As the International Monetary Fund (IMF) and the World Bank calibrate their rankings, the narrative of the "Bharat Century" moves from a theoretical projection to an empirical reality, providing a critical engine for a global economy currently navigating the complexities of fragmentation, protectionism, and the transformative impact of artificial intelligence.
The Framework of Global Economic Hierarchies
To understand the mechanics of how India surpassed Japan and what this implies for the global order, it is necessary to examine the foundational methodologies used by international institutions to rank nations. Nominal GDP, expressed in current U.S. Dollars, remains the definitive benchmark for assessing the relative economic weight of a nation on the international stage. Unlike Purchasing Power Parity (PPP), which adjusts for the cost of living and is useful for comparing standards of living, Nominal GDP measures the actual monetary value of goods and services produced at current market prices, reflecting a country’s ability to command resources and influence global markets.
The Mechanism of Global GDP Calculation
The process of assigning ranks to nearly 200 countries is a data-intensive endeavor spearheaded by the IMF’s Statistics Department and the World Bank. These institutions rely on the System of National Accounts (SNA), an international standard that has evolved through the 1993 and 2008 versions to ensure that data from disparate political and economic systems remain comparable. The IMF employs a "bottom-up" approach, where individual country desk officers conduct missions to member nations, analyzing high-frequency indicators, government financial records, and private sector surveys to build a granular picture of national output.
GDP is theoretically derived through three equivalent methodologies: the production approach, which sums the "value added" at each stage of production; the income approach, which totals the earnings of all factors of production; and the expenditure approach, which aggregates final spending by households, businesses, and governments. The expenditure identity is perhaps the most relevant for policy analysis:
Y = C + I + G + (X - M)
This formula identifies Private Consumption (C), Investment (I), Government Spending (G), and Net Exports (X-M) as the four pillars of growth. India’s recent ascent is largely attributed to the robust performance of the C and I components, whereas Japan’s relative decline is rooted in the stagnation of its domestic consumption and a structural dependency on exports that are increasingly vulnerable to global trade volatility.
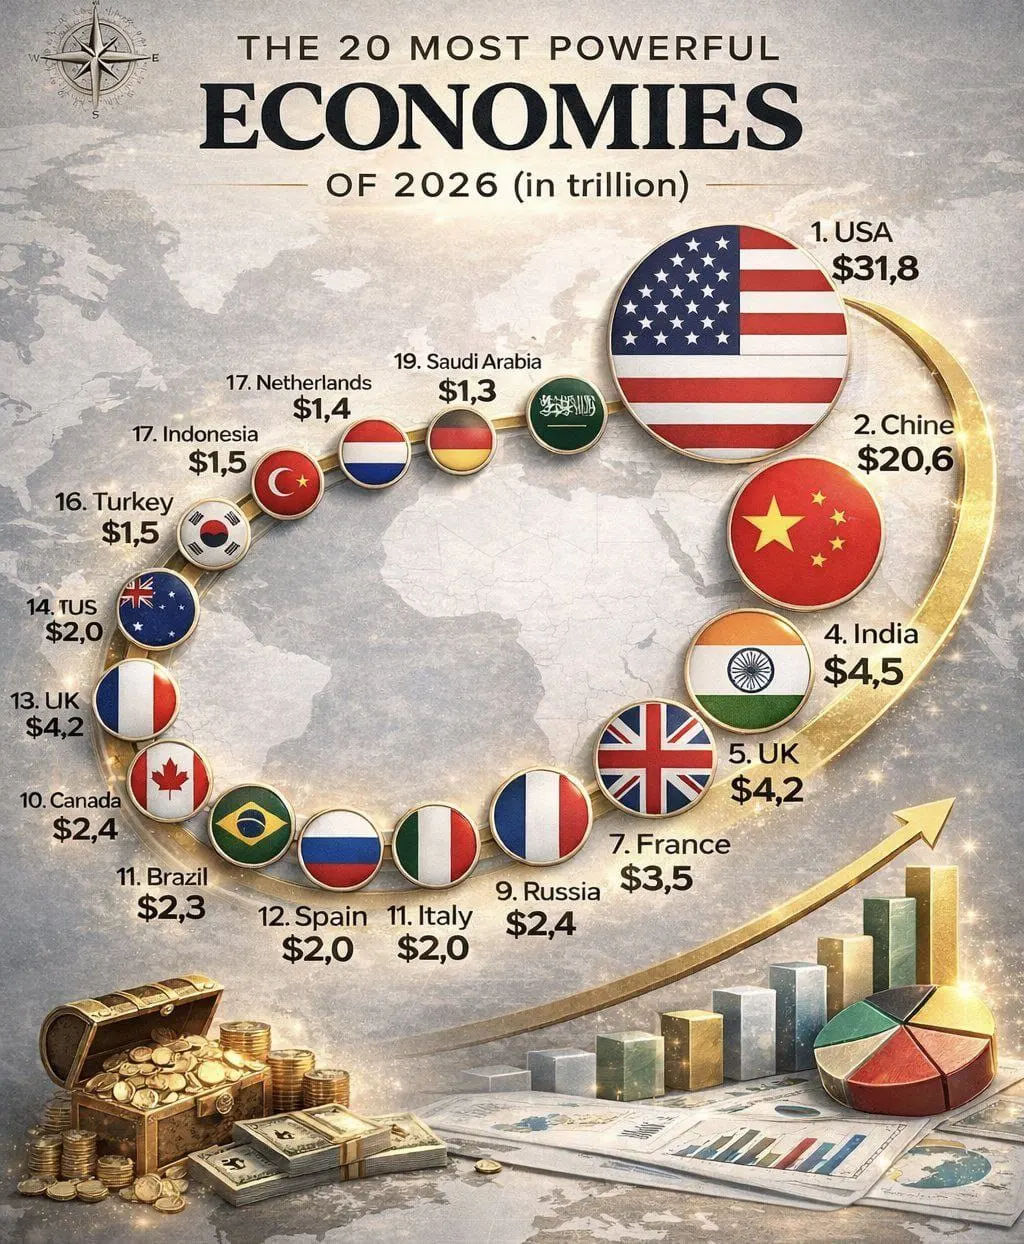
Table 1: Projections for the 20 Largest Global Economies in 2026
Rank | Country/Region | Projected 2026 GDP (Trillions USD) | Real GDP Growth Rate | GDP Per Capita (USD) |
1 | United States | $31.82 | 2.1% | $92,883 |
2 | China | $20.65 | 4.2% | $14,730 |
3 | Germany | $5.33 | 0.9% | $63,600 |
4 | India | $4.51 | 6.2% | $3,051 |
5 | Japan | $4.46 | 0.6% | $36,391 |
6 | United Kingdom | $4.23 | 1.3% | $60,011 |
7 | France | $3.56 | 0.9% | $51,708 |
8 | Italy | $2.70 | 0.8% | $45,883 |
9 | Russia | $2.51 | 1.0% | $17,287 |
10 | Canada | $2.42 | 1.5% | $58,244 |
11 | Brazil | $2.29 | 1.9% | $10,709 |
12 | Spain | $2.04 | 2.0% | $40,582 |
13 | Mexico | $2.03 | 1.5% | $15,111 |
14 | Australia | $1.95 | 2.1% | $69,358 |
15 | South Korea | $1.94 | 1.8% | $37,523 |
16 | Turkey | $1.58 | 3.7% | $18,232 |
17 | Indonesia | $1.55 | 4.9% | $5,398 |
18 | Netherlands | $1.41 | 1.2% | $77,881 |
19 | Saudi Arabia | $1.32 | 4.0% | $35,839 |
20 | Poland | $1.11 | 3.1% | $30,651 |
Data synthesized from the IMF World Economic Outlook (October 2025/April 2026) and consensus forecasts.
The Indian Engine: Drivers of a Trillion-Dollar Leap
India’s transition to the fourth-place position is the result of a persistent growth rate that has more than doubled the size of its economy in just over a decade. While many advanced economies struggle with sub-2% growth, India has maintained a "Goldilocks" phase of high growth coupled with relatively stable inflation, enabling it to leapfrog larger, established incumbents.
The Primacy of Private Consumption and Domestic Demand
Unlike the export-led models of East Asian neighbors, India’s growth is fundamentally domestically driven, with private consumption accounting for nearly 60% of its total GDP. This domestic orientation provides a significant cushion against external shocks, such as the tariff uncertainties emerging from the United States or the cooling of the Chinese real estate market. In the 2025-26 fiscal year, India’s real GDP grew by a stunning 8.2% in the second quarter, fueled by a surge in rural demand and resilient urban consumption.
The government’s strategic use of fiscal policy has further empowered the consumer. Recent rationalizations of the Goods and Services Tax (GST) have reduced the cost of essential household items, consumer durables, and medicines, directly boosting disposable income for middle-class families. For salaried individuals, an increase in the nil-tax threshold to approximately Rs 12.75 lakh (after standard deductions) has injected liquidity into the urban economy, manifesting in record sales for automobiles and travel services.
Digital Public Infrastructure and Financial Inclusion
A second-order insight into India’s growth reveals the role of the "JAM trinity" (Jan Dhan, Aadhaar, and Mobile connectivity) in streamlining the national economy. By creating a frictionless digital payments ecosystem through the Unified Payments Interface (UPI), India has formalized millions of small businesses that previously operated in the shadow economy. This formalization has not only increased tax compliance but has also allowed for the direct, transparent delivery of government benefits, effectively eliminating leakages and ensuring that developmental capital reaches the intended recipients.
The scale of this digital transformation is unprecedented. Today, approximately 90% of India’s Micro, Small, and Medium Enterprises (MSMEs) accept digital payments, although only 18% have yet accessed digital lending platforms. This "credit gap," estimated at nearly ₹30 lakh crore, represents a massive latent opportunity; as these enterprises gain access to formal credit through their digital footprints, their ability to scale and invest will likely provide the next leg of India's GDP expansion.
The Fall of the Rising Sun: Structural Stagnation in Japan
Japan’s descent to the fifth-place position is the byproduct of long-standing structural challenges that have proved resistant to traditional fiscal and monetary interventions. The contrast between India’s demographic youth and Japan’s demographic winter is the most potent explanation for the divergence in their economic trajectories.
The Demographic Drag and Labor Supply
Japan is currently facing a "demographic cliff," characterized by a rapidly aging population and a birth rate far below replacement levels. This leads to a shrinking domestic market and a persistent shortage of labor in key sectors such as manufacturing and eldercare. While Japan remains a leader in robotics and automation, these technologies have served more as a means of stabilization than as a catalyst for new growth. Consequently, Japan’s GDP growth is projected to average less than 1% for the remainder of the decade, making it the weakest performer in the G7 alongside Italy.
Deflationary Mindsets and Monetary Constraints
For decades, Japan struggled with deflationary pressures that discouraged consumption and investment. While the Bank of Japan has recently achieved its goal of sustainable inflation accompanied by wage growth—raising its policy rate to a neutral level of 1%—the transition away from a zero-interest-rate environment has been cautious. The weakness of the Yen against the U.S. Dollar has also played a dual role: while it has supported the profitability of export-oriented giants like Toyota and Sony, it has inflated the cost of imported energy and raw materials, further squeezing the domestic consumer. In the context of nominal GDP rankings, the depreciation of the local currency significantly reduces a nation’s dollar-denominated economic size, which was a critical factor in Japan’s fall behind India and Germany in the 2025-26 period.
Timeline to the Top: The Road to 2030 and 2075
The current milestone—surpassing Japan—is viewed by many analysts as a precursor to even more significant shifts in the global hierarchy. India’s immediate target is the third-place position currently held by Germany.
Overtaking Germany by 2028-2030
Economic consensus from the IMF and S&P Global suggests that India will likely overtake Germany to become the world's third-largest economy by the fiscal year 2027-28 or 2030 at the latest. Germany’s economy, while highly sophisticated, is currently grappling with high energy costs, a slowdown in Chinese demand for its industrial machinery, and its own demographic challenges. If India maintains its projected annual growth rate of 6.7%, its GDP will reach approximately $7.3 trillion by 2030, a figure that would comfortably displace Germany.
The Path to 2075: A New Bipolarity
Looking further ahead, projections from Goldman Sachs indicate that by 2075, the global economic order will be dominated by China and India, with the United States falling to third place. At that horizon, India’s GDP is forecast to reach $52.5 trillion, slightly surpassing the United States’ $51.5 trillion. This transition is contingent on India’s ability to increase its labor force participation rate, particularly among women, and to continue its trajectory of innovation and capital investment.
Table 2: Long-Term Global GDP Projections and Population Context (2075)
Rank | Country | Projected 2075 GDP (Trillions USD) | 2075 Population (Millions) | GDP Per Capita (2075 USD) |
1 | China | $57.0 | 1,000 | $57,000 |
2 | India | $52.5 | 1,600 | $32,812 |
3 | United States | $51.5 | 400 | $128,750 |
4 | Indonesia | $13.7 | 315 | $43,492 |
5 | Nigeria | $13.1 | 480 | $27,291 |
6 | Pakistan | $12.3 | 450 | $27,333 |
Long-term modeling based on demographic transitions, capital accumulation, and TFP (Total Factor Productivity) growth.
A third-order insight from the 2075 projections is that while India and China will be the largest economies by size, the United States will remain significantly wealthier on a per capita basis—roughly twice as rich as both. This underscores the difference between "economic power," which is collective, and "economic prosperity," which is individual.
Human Impact: Lifestyle, Poverty, and the Growing Middle Class
The transition to a $4.5 trillion economy is fundamentally altering the lifestyle of the average Indian citizen. While the per capita income remains low compared to the G7, the rate of change is transformative.
The Middle-Class Consumption Revolution
The rise in GDP has fueled an expanding middle class with high aspirations. There is a noticeable shift from spending on "essentials" to "discretionary" categories. Travel and tourism are booming, supported by improved infrastructure and increased affordability. The healthcare sector is also seeing increased penetration, with greater awareness and insurance coverage leading to higher life expectancy—now at a record 72 years in India.
Poverty Reduction and Social Inclusion
Economic growth has been the most effective tool for poverty reduction. The share of the population in extreme poverty dropped from 16.2% in 2011-12 to just 2.3% in 2022-23. This progress is supported by social protection programs like MGNREGA (rural employment guarantee) and Jan Dhan Yojana (universal banking). The UNDP notes that India’s model demonstrates that rapid growth and social inclusion can advance together, particularly through the use of technology to ensure that "no one is left behind".
The Employment Challenge
However, the "youth bulge" is a double-edged sword. India’s growth story depends on its ability to generate quality, well-paid jobs for the millions of graduates entering the workforce annually. While the urban unemployment rate has dropped to 4.9%—its lowest level in years—the high level of informality and the low female labor force participation rate (currently around 41.7%) remain significant structural bottlenecks. To achieve developed country status by 2047, India will need to sustain an average annual growth rate of 7.8% and increase its real investment rate to 40% of GDP.
Regional Dynamics: The Ascendance of Asia
The realignment of national ranks is part of a broader geographical shift. In 2026, Asia has officially surpassed North America as the world's largest economic region.
Table 3: Global Economic Output by Region (2026)
Rank | Region | Projected GDP (Trillions USD) | Leading Economies |
1 | Asia | $39.06 | China, India, Japan, Indonesia |
2 | North America | $37.10 | United States, Canada, Mexico |
3 | Europe | $31.63 | Germany, UK, France, Italy |
4 | Middle East | $5.45 | Saudi Arabia, UAE, Israel |
5 | South America | $4.51 | Brazil, Argentina, Chile |
6 | Africa | $3.32 | Nigeria, Egypt, South Africa |
7 | Oceania | $2.28 | Australia, New Zealand |
Regional aggregates are based on PPP-weighted shares and market exchange rate conversions.
This regional dominance is driven not just by the giants—China and India—but by a tier of high-growth "Strategic GDP Climbers" like Indonesia and Vietnam.16 Indonesia, in particular, is emerging as Southeast Asia’s manufacturing hub, leveraging its demographic advantage and policy reforms to edge up the global list.
Methodological Nuances: How Ranks are Assigned to Every Country
A common query among observers is how international institutions ensure that a trillion-dollar economy like India is accurately compared with a billion-dollar economy like Tuvalu. The process involves multiple layers of standardization and reporting.
The Role of National Statistical Agencies
The primary source of data is each country’s national statistical agency (such as India’s NSO or the U.S. Bureau of Economic Analysis). These agencies compile data from tax records, customs data, industrial surveys, and agricultural censuses. However, the quality of this data varies; the IMF often has to provide technical assistance to low-income countries to improve their national accounting.
Nominal vs. Real GDP and the Deflator
To track progress over time, economists use "Real GDP," which removes the effects of price changes using a "price deflator". When comparing countries for a global rank, the IMF uses "Nominal GDP" converted at market exchange rates.6 If a country has high inflation but its currency remains stable, its nominal GDP and global rank may rise rapidly, even if its actual production hasn't increased as much. This is why institutions like the IMF also calculate "volume estimates" to ensure that the growth reflected in the rankings is substantive.
The Reporting Cycle
The IMF updates its database constantly, but the major global rankings are published in the World Economic Outlook (WEO) in April and October. There are also January and July updates to account for sudden shifts, such as geopolitical shocks or major policy changes (e.g., the introduction of significant tariffs). The rankings for a year like 2026 are based on "projections" until the final annual data is released and verified in late 2027.
The Resilience Factors: Navigating a Fragmenting World
India’s ascent comes at a time when the global economy is described by the IMF as "adjusting to a lower-growth equilibrium". Global growth is expected to slow from 3.3% in 2024 to 3.1% in 2026, hampered by debt, aging populations, and "deglobalization".
Offsetting the Tariff Shock
One of the most significant risks to the 2026 outlook is the resurgence of protectionist trade policies. High tariffs on Chinese goods and the potential for a trade dispute between the U.S. and India could test India’s economic resilience. However, India has been proactive in deepening trade relationships with diverse geographies, including signing trade deals with the UK and negotiating with the EU. These agreements are intended to diversify export markets and integrate India more deeply into non-U.S. centered supply chains.
The Role of Institutional Independence
A deeper insight provided by the IMF is the correlation between "institutional independence" and economic stability. Countries where central banks and statistical agencies remain independent of political interference tend to make better long-term policy decisions. India’s ability to maintain high growth while curbing inflation (which fell to record lows in late 2025) is cited as a testament to its improved policy frameworks and the credibility of its monetary policy.
Sectoral Deep-Dive: The Infrastructure and Energy Transition
India’s path to the third rank by 2030 will rely heavily on its energy strategy and infrastructure buildout.
The Infrastructure Multiplier
The government has prioritized Capital Expenditure (CAPEX), with massive investments in roads, railways, and ports. This "infrastructure multiplier" not only creates immediate jobs but also reduces the cost of logistics, making Indian exports more competitive globally. The HSBC India Purchasing Managers' Index (PMI) consistently shows that India has the highest private sector output expansion worldwide, a direct result of these improvements in the ease of doing business.
Balancing Energy Security and Sustainability
As India grows, its petroleum demand will continue to rise for the next decade. However, the country is simultaneously undergoing an "energy transition," with significant investments in renewable energy and green hydrogen. The goal is to reach net-zero by 2070, but the medium-term challenge is balancing the cost of sustainable technologies with the need for affordable energy to power its industrial expansion.
Table 4: India's Macroeconomic Indicators - A Decade of Transformation (2016-2026)
Metric | 2016 Value | 2026 Projected Value | Percentage Change |
Nominal GDP (USD) | $2.29 Trillion | $4.51 Trillion | +97% |
GDP Per Capita (USD) | $1,710 | $3,051 | +78% |
Inflation (CPI) | 4.9% | 2.5% | -49% (Improvement) |
Current Account Deficit | 1.1% of GDP | 1.3% of GDP | +18% |
Foreign Exchange Reserves | $360 Billion | $750 Billion | +108% |
Urbanization Rate | 33% | 38% | +15% |
Data synthesized from RBI, IMF, and World Bank historical and projected databases.6
Risks and Contingencies for the Bharat Century
While the trajectory is positive, several "downside risks" could derail the projection that India will reach $7.3 trillion by 2030:
Climate Change: Extreme weather events, such as heatwaves and unseasonal rains, remain a major threat to agricultural productivity and food inflation.
Tech Repricing: A sudden market correction in technology stocks could threaten global financial stability and reduce the capital available for India’s burgeoning tech sector.
Geopolitical Volatility: Ongoing conflicts in the Middle East or an escalation of tensions in the Indo-Pacific could trigger energy shocks that India, as a net importer of oil, is particularly vulnerable to.
Labor Absorption: If the education system fails to keep pace with the needs of the modern economy, India may face a "middle-income trap" where it has a large population but not enough skilled workers to drive high-value services.
Strategic Synthesis and Future Outlook
The rise of India to the fourth-largest economy is a symbolic and substantive victory for a development model that prioritizes domestic resilience and digital innovation. By surpassing Japan, India has proven that demographic scale, when combined with structural reform and digital public infrastructure, can overcome the stagnation that often plagues large, maturing economies.
The path from $4.5 trillion in 2026 to the projected $7.3 trillion in 2030 requires a shift from government-led infrastructure spending to a broad-based recovery in private sector corporate investment. This transition will be influenced by global trade realignment and the ability of domestic buffers to cushion against external shocks. For the global community, India’s ascent provides a much-needed growth engine in a period of advanced-economy stagnation. For the Indian citizen, the journey from 2026 to the independence centenary in 2047 represents an opportunity to convert national economic weight into individual prosperity, transitioning from a "medium human development" category to a "high-income" society where the benefits of growth are inclusive, sustainable, and transformative.
Join our WhatsApp and Telegram Channels
Get Knowledge Gainers updates on our WhatsApp and Telegram Channels